** Disclaimer to all new readers – This blog post is VERY old and not really representative of my current work. I’ve just left it up here for historical purposes. If you are interested in learning more about packet analysis I’d reccommend reading some of my newer posts or looking at my book, Practical Packet Analysis. **
If you are reading this then it means you probably enjoyed the first part of my series on packet analysis, so if that is the case, welcome back! In this installment we are going to analyze our first trace file to learn some more packet analysis basics. I am going to assume that you have played around with Ethereal a bit and am going to forgo the explanation of all the different windows within it and things of that nature. Before we start you are going to need to download the sample trace file we will be working from. I obtained this trace file as well as a lot of others I will be using from Laura Chappell, Sr. Protocol Analyst for the Packet Level Protocol Analysis Institute (http://www.packet-level.com).
Our First Analysis – Downloading a File
Click here to download sample trace file (approx. 13MB)
Downloading a file is a pretty basic function when described at the network/transport layer. A client request a file from a server via HTTP and the file responds with this file. This takes the form of several packets as the file downloaded is segmented into various size packets for transport across the networks it must traverse to reach its destination. In our trace file we are going to look at an example of downloading a file from two different servers. The first server we will look at is going to be an extremely slow server so that we can look at some of the various problems that Ethereal will show us. After this we will look towards the end of the trace file for an example of what a healthy file transfer looks like.
The first thing we want to look at is the I/O graph of the packet capture. The I/O graph is customizable with a lot of various options and is a great way to visual interpret some of the data you have captured. To view the I/O graph of this packets capture click “Statistics” on the menu bar and then select “IO Graphs”. Once you have done this you are going to need to look towards the bottom right corner of the screen and change the “packets/tick” option to “bytes/tick”. This will provide the information to us in a form that is much more useful. You may feel free to change any other visual settings in this window.
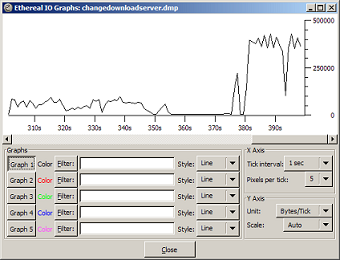
Looking at the I/O graph for our packet capture we notice that traffic is slightly eleveated near the beginning of the capturing before flattening out. Then towards the end of the capture traffic spikes to a new high with a slight drop in the middle. Knowing that we are looking at an example of a fast and slow download we can easily distinguish where the two downloads take place just by looking at this graph. Let’s look at the packet capture and see what else we can determine about these downloads.
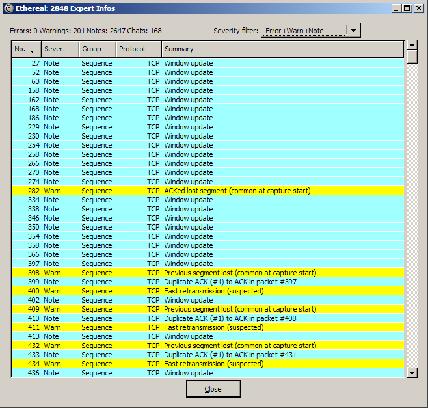
Scrolling through all of the packets you will see a lot of various information. The biggest portion of this is normal traffic and is therefor uesless to us as we are only looking for abnormal traffic. In order to filter this abnormal traffic out we are going to use a new feature in Ethereal called the expert info window. To open this window you can simply click on “Analyze” in the menu bar and select “Expert Info”. By default, the expert info window is going to show us all warning, error, note, and chat communication. Chat communication does not really constitute abnormal traffic, therefor we are going to change this settings to show only warnings, errors, and notes by changing the appropriate setting under the “Severity filter” heading.
Anatomy of a Slow Download
Looking at the expert information window there are a few things we want to discuss right away. The first thing you will see in abundance are TCP Window Update packets. If you are familiar with TCP/IP you know that the transmission rate of data is determined by the size of the TCP recieve window. When transferring data between clients they will constantly send TCP Window Update packets to each other as there ability to recieve data speeds up or slows down.
The next thing we want to look at is where we have our first problematic packets. As the download starts you being to see “Previous segment lost” packets. Basically what this is saying is that during the course of data transfer, all of a suddent a packet is dropped. In response to this the client sends what you are seeing as “Duplicate ACK” packets to the server in order to request to packet that was dropped. The client will continue sending these duplicate ACKs until it finally recieves the packet it was looking for. The retransmission of this missing packet is what you are seeing as “Fast retransmission” in the expert info window. At the start of the download you are only seeing one or two duplicate ACKs at once but as the download progresses you begins seeing more and more of them which means you are experiencing more latency. At this point you can browse through the rest of the capture and see that it is riddled with these segment losses and duplicate ACKs. If you browse to the end of the capture file however, you will notice this is not the case. In this instance there are only one or two dropped packets in the successful download.
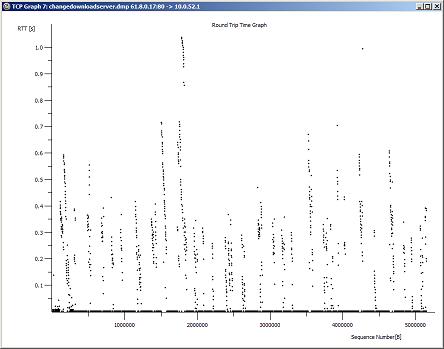
One last thing we are going to look at is another way to visually represent the packet capture data called the “TCP Stream Graph”. You can access this graph by clicking on a packet related to the stream you wish to analyze (in the case you can select packet number 1023) and going to “Statistics”, selecting “TCP Stream Graph” and clicking on “Round Trip Time Graph”. This graph is not too visually pleasing but is a great way to compare round trip time (RTT) throughout a packet capture. You will notice near the beginning of the capture with the slow download we are seeing RTT of up to one full second. This is complete unacceptable for downloading a file. Even when downloading a file off of the internet you should see times at no more than 0.1 seconds. An ideal RTT for data transfer across the internet is no more that 0.04 seconds (40 milliseconds). Looking at the beginning of the graph as compared to the high speed download at the end of it can produce some draw jopping results.
Homework
I would encourage you at this point to try taking some packet captures of downloading various files on the internet. See if you can find a high utilization server somewhere so you can view the packets of a slow download you did yourself. This will help you to better understand what we learned today. In the next installment of Packet School 101 we are going to examine a trace file from a network in which there are router performance problems.

Several distance learning programs allow people to have professional degrees and IT certifications, without having their tangible presence in scheduled classes. For exam training purposes MS 642-552 study guide available that features Q&A with explanation. Microsoft designed MS 70-536 certification while keeping in view the emerging trends in IT. Today, acquiring new MS 70-553 IT certifications would be a valuable increase in your certifications.

Um… where’s the sample trace file we’re supposed to download before we begin? I don’t see it linked anywhere in the posting.
Appears I did forget to link the download to the trace file. Should be fixed momentarily. Thanks for the heads up!
If you want some more information about capture filters check this site out.
http://home.insight.rr.com/procana/
thanks for this lesson. i’ve ethereal for a while but never really spent any time learning it. looking forward to the next installment.
There is no expert mode in Ethereal 0.10.12 under the Analyze menu.
“Expert Info” is listed under the Analyze context menu on the version I am running. I am currently running 0.99.0 which I just downloaded near the beginning of last week.
Thanks for the info, can’t wait for the next installment. I’m just trying to learn this stuff and your really helping.
Some switches have a feature that allows you to make a switchport into a monitoring port if you don’t have a hub. Many Cisco switches and routers have this feature.
Another alternative is ARP poisoning, but I may be getting ahead of the lessons.
Thank you for the time and effort you put into this material. It is fascinating to see the TCP/IP stack at work. Having taken classes devoted to TCP/IP and being a book-only CCNA is now paying off as I can now follow what is happening in the graphs and other Wireshark displays. It’s coming together and making sense in a much more tangible way.
And it’s free!
Keep up the good work. You guys are the greatest.
Sincerely,
Malcolm Hein
PS: I normally do not gush like this. So you KNOW you must be doing something good.
I am running linux FC6 with wireshark 0.99.4, on part two I can not get the list shown on expert infos, can you help me how to get it?
Thank you for the lesson. I go through all your steps and others that i have to include, but, I have problem to take the graphs and other expert information and pest to my report. If you can help me in this.
Thank You.
Thank you for the lessons, I truly enjoyed the content since this is what I am studying in school at this moment, which is Network Security, I find your website very tasteful, down to earth but very professional; once again thank you for the lessons.