** Disclaimer to all new readers – This blog post is VERY old and not really representative of my current work. I’ve just left it up here for historical purposes. If you are interested in learning more about packet analysis I’d reccommend reading some of my newer posts or looking at my book, Practical Packet Analysis. **
The response from this series has been tremendous! As of yesterday I have managed to make the front page of digg.com and make #2 on the list of the most linked sited on del.icio.us. I have seen my bandwidth grow exponentially and have logged over 5 GB of traffic in the past 24 hours. I have also had a lot of great comments regarding the first two parts that I hope to address later on in the series. I plan on ending with a Q & A so if you have any major questions feel free to e-mail me.
Troubleshooting a Slow Router
Download the sample trace file by clicking here (<1 MB)
In this section we are going to look at a client who is trying to connect to a website but it experiencing all kinds of network slowness issues. Opening the sample trace file, the first thing you will notice is a lot of ARP broadcast packets. These are typical in a lot of network environments for layer 3 to layer 2 address resolution. For the purpose of what we are doing here, we are going to remove these from out trace file so that they don’t clutter things up. You can do this by typing “!arp” in the filter text box near the top of the Ethereal window.
Getting on Time
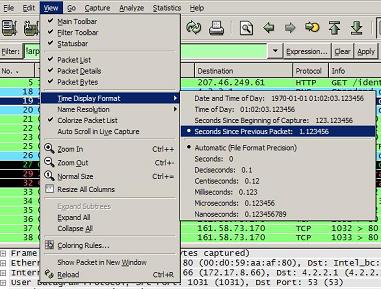
At this point in our learning it is pertinent to take notice of the “Time” column in the main Ethereal window. You will see a time listed next to each packet, and by default, this shows the time the packet was recieved in relation to the beginning of the packet capture. This type of view has its purposes in some settings, however, for troubleshooting a slow network you will want to change this setting to display the time relative to the packet recieved previously. You can do this through by going to View > Time Display Format, and selecting “Seconds Since Previous Packet”. In this new time view you will notice that the times are now displayed as the amount of time since the previous packet was captured. For example, packet 4 was recieved 1.728522 seconds after packet 3. This will be much more handy to us in our troubleshooting of the slow network communication.
Looking for the Source of the Latency
Now that we have our time column set to display data to us in a much more helpful way, scrolling down through the trace file we see our first major network activity at packet 18 where the client (172.17.8.66) makes an HTTP request to get the website www.packet-level.com. Typically, the next packet we see should be the dns servers response to the client. In this case however, the server does not respond back to the client, so the next packet we see is over a second later and is the client attempting to request the webpage a second time. After this second request we finally see a response from the DNS server pointing us to the IP address of the web server in packet 20. In an ideal situation, as soon as this dns query is completed the client and server should begin a standard TCP/IP handshake (SYN, SYN/ACK, ACK), and in our case the client does its part sending it’s initial SYN packet out within 4 milliseconds (third place from the decimal point is milliseconds) of recieving the DNS response. The server on the other hand responds an incredible amount slower taking over half a second to send its SYN/ACK reply. At this point we can definitely begin to see that it is something other than the client causing the network latency.
Interestingly enough as we continue down into the trace, in packet number 26 we see a second DNS reply from the server. This the reply to our second DNS request that we made initially. The only problem is that it is about 5 seconds too late! Given that our client computer has already established a connection with the server there is no real need for this second connection, and it throws up an ICMP destination unreachable packet immediatly following the reciept of the DNS response.
Going back to our already established connection to the server, we begin to see problems sprouting up. After making our initial TCP/IP handshake the client requests the actual content of the webpage at packet 25. Quite some time goes by and then in packets 29 and 32 we see two TCP Retransmission packets. In this case, the client has requested the webpage, not gotten a response, waited a certain amount of time, and sent a retransmission to the server in order to make another attempt at getting the data. After the third retransmission we finally see a response from the server in packet 33. Now if you add up the times from packets 25 to 33 you will see it has taken us nearly 9 seconds to get the first bit of data from the webpage we are requesting. It doesn’t take a packet analyzing expert to realize this is entirely unacceptable.
Fixing the Problem
Given the information we have just seen we know that the client is not at fault for the slow communication. The principal rule of thought for figuring out the problem location is to move upstream along the network. In this network, the next step would be to look at the router to see if it is malfunctioning in any way. Upon rebooting the router on this particular network, the speed of data communication increased tremendously and the problem was solved. However, if the problem had not been the router then you would need to move upstream to the router of the network in which the web server you are connecting to is behind. Unfortunately when that is the case you typically do not have the power over the remote network to do anything about it.
Homework
In our next installment we are going to look at a spyware infection and its effects on a workstation. Now that you understand the concept of restransmissions and latency you may be asking yourself what exactly is a good time for something such as a website request to take place? The best thing to do in this case is to sniff the packets on your own network whenever you are not having any issues. Ideal communication times are going to vary for each and every network you are on so this is another case in which you will want to sniff your own network. Getting to know what the packets look like in your network when it is healthy will SURELY pay off in the future.

With the help of Internet technology, you can find wide range of available online IT courses and certifications. You can search out online schools that offer certification for MS 70-296. Online instructors help you in grasping the tricky concepts of MS 70-620. Free and fast registration for MS 70-554 is also available for business professionals.

This is good stuff Chris. Keep it up. I’d love to see more lessons on other topics in the future.
good stuff, i use alot of this at work,,, i was wondering if you can elaborate on the coloring of the capture ..
and if thier is a was to start a capture every lets say 60 seconds to have a long but not big trace of the network health
good.thanks.
A great introduction to a subject I know little about.
Keep up the good work.
I saw that you say “remove” the ARP packets from the filter, Don’t forget that layer 2/3 transversal with MAC broadcasts causes the NIC or NODE interface to stop everything that it is doing to check to see if it has the IP address in the ARP question, if this happens too fast, too many arp questions per milisecond, the NIC will not let logical layer request physical layer time, untill the ARP stream has stopped long enough for the logical layer’s IRQ to be listened to, most nics require =/>4ms between ARP packets to see any other requests.. you wind up with a latency on the original IRQ for however many ms it takes for the stream of ARP packets to stop long enough for that window of time etc or some such thing… it takes a little break to talk out on the network, you can even get lack of receival of requested packets if more ARP streams continue after the original request goes out, the incoming packets are hitting a brick wall, most consumer devices do not have the MEMORY capacity to store the incoming ack’s and stuff long enough so their ttl expires waiting for arp questions to be finished… some hackers have the MS down to an art where they can determine exactly when they need to issue arp’s to block connectivity, without an actual tracable DOS, because they are employed by the ISP, so if they got caught, they would face serious fraud charges for causing many people to pay for inhome computer service repair by the ISP crew while their partner reconfigures the router to stop the ARP wave 🙂
This is extremely helpful….I am actually understanding the flow…Can you please put some more exercise for Entry Level students?
Chris – Just some Eratta: You instruct the reader to remove arp packets from view, then you talk about time and reference the time difference between packet 3 and packet 4 which should be filtered out if the reader is diligently following your instructions.
Anonymous – Good catch. I am in the habit of always clearing my filters after everything I do so I never ran into this, but I could see where someone could. I made the mistake of forgetting to clear my filter one to many times and eventually it just got ingrained into me. Thanks!